The Brightness Levels Dialog
|
|
Click the Levels Tool icon on the Photo Tool fly-out bar. |

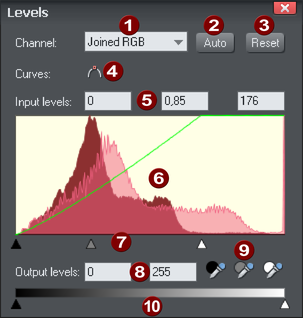
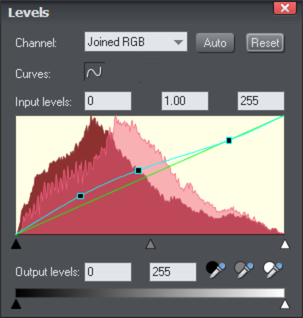
The Levels Tool provides detailed control over the brightness levels of photos. It's a very powerful, multi-purpose tool that not only shows a histogram of the brightness levels of the photo, but provides a greater degree of control than the simple brightness or contrast controls. It can lighten shadows without affecting other parts of the picture. It can adjust the white balance of a picture and also the black and white points.
|
|
Channel selector |
|
|
Auto (= Auto-Enhance in the Enhance tool) |
|
|
Reset |
|
|
Toggle curve |
|
|
Input levels and Brightness value (Gamma) |
|
|
Histogram |
|
|
Visual input levels and brightness adjust (black point, brightness, white point) |
|
|
Output levels |
|
|
Black/gray/white point picker |
|
|
Visual output level adjust |


The red histogram graph shows the distribution of brightness levels in the selected picture, ranging from the blackest shades on the left to lightest (white) shades on the right. The height of the red graph indicates the amount (i.e. the number of pixels) of each shade used in the picture. Typically a correctly exposed photograph would show a spread of brightness levels across the range, dark to light, as in the above example. Here are some pictures and example histograms.
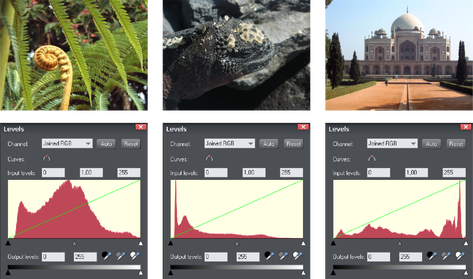
- The first image shows a good spread, from the darkest to lightest shades, with a predominance of mid-brightness shades.
- The second image is obviously very dark, and the histogram reflects this with peaks at the dark (left) end.
- The third image has peaks at the bright (right) end which are typical for images that have a bright sky. There is nothing wrong with this and the overall exposure is about right and you can see a good distribution of shades across the histogram.
Adjusting brightness
Dragging on the center gray triangle adjusts the brightness (technically this is altering the gamma). It does the exact same thing as the brightness slider on the InfoBar.
The brightness slider alters the darker shades in a picture more than it does the lighter shades, so it is particularly good for revealing details in shadows.
Selecting the black, gray and white points

The three eye-dropper icons can be used to pick the black, gray or white points on the photo, and adjust the three controls for you automatically. These tools have the advantage that they also adjust the white balance or color cast that your photo might have.
- Click and drag one of the icons from the levels dialog over your photo. As you do this you will see the photo change. Release the mouse buttons when you're happy with the change.
So to set the black point automatically you'd drag the black eye-dropper over the blackest part of your photo. Similarly, you'd drag the white eye-dropper over the whitest part of your image.
Note: These are buttons which can be dragged - they do not work by selecting the button and then clicking again on the photo. Instead you must drag them over the photo. These are interactive, so as you drag the picture is changed.
Color cast - fixing the white balance
The middle of the three eye-droppers sets the gray point and this is mostly useful for altering the white balance of your photos. You drag it from the Levels Dialog, like the others, but drag it over any point in the picture that is meant to be gray. In doing this the balance of colors is altered to try and make the item under the mouse pointer a pure shade of gray, and thus alters the color balance of the whole picture.
If you have a photo taken with the wrong light setting, they will come out orange or blue. This control can help fix this, although in bad cases it will never be possible to make them perfect.
Tip: If there are no gray objects in the picture, find anything that is meant to be white and look for an area that's in shade or less than bright white.
Tip: If you have multiple pictures taken with the same color cast, you can copy the correction from one to another using the Copy / Paste Attributes feature.
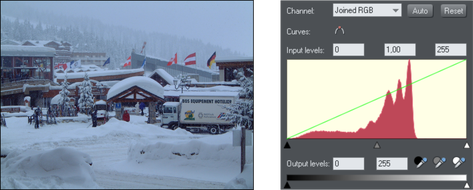
Here is an example, a snow scene, that is badly under-exposed, and with a strong blue cast. Its histogram on the right shows the white levels are poor.
By dragging the white eye-dropper from the Levels dialog over the whitest part of the image, it not only restores a better overall histogram, but also corrects the blue cast so that the white snow really is white.
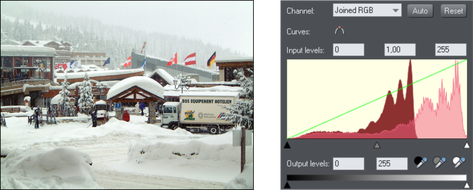
The corrected histogram now shows a much better balance (it's largely at the white end, but that's to be expected in a snow scene).
Auto Levels
The Auto button will automatically adjust the white and black points to correspond to the lightest and darkest shades in the selected picture. This works better for some images than others (the above snow scene works perfectly, so in fact this can be corrected with a single click).
Reset
The "Reset" button will reset all levels parameters back to their starting values. The "Compare" button on the Photo Tool's InfoBar also does the same thing, but has the advantage that pressing it again restores the altered settings.
Advanced Levels - The Green Line
For the more advanced user, the levels control is really mapping the range of input brightness levels to an alternative set of output levels. Overlaid on the red histogram is a green line that represents the mapping function.
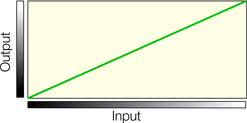
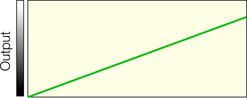
The default straight line means no change, so dark shades are mapped to dark, and light to the same light shades. But as you alter the controls the green line is altered to reflect the new mapping. So, for example, increasing the brightness or gamma control will change the line like this;
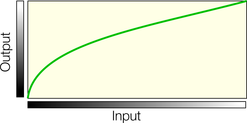
You can see now that it's no longer a straight line mapping, and that the darker input shades will be mapped to corresponding lighter output shades.
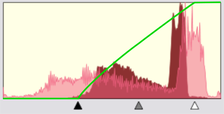
Using one of the low contrast examples above, this is the altered histogram, showing the before, after and altered green mapping function line.
You can see the black and white points are moved inwards. This is reflected in the green line which shows that mid-shades are now mapped to dark, and the lightest white points (about 80% along the horizontal) are now mapped to white. Thus the narrow range of input shades is mapped to the full dark-to-light range of output shades.
Output Levels
The two lower controls adjust the minimum (black) and maximum (white) final output levels. Adjusting these has the effect of reducing the contrast.
Tip: It is usually recommended that for printing purposes the photos do not contain pure white, but instead have a maximum "whiteness" of around 90%, especially when printed in black and white. The histogram makes it easy to see if there is a lot of pure white (peaks at the far right end), and by adjusting the white output level slider you can easily control this.
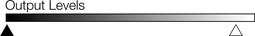
Dragging the "White output level" slider inwards slightly alters the green line:
Meaning the maximum white value is brought down slightly.
Brightness Curves
In the Levels dialog you can create a manual brightness curve which provides very detailed control over brightness levels for any photos.
To create a manual curve just click or drag on the histogram area, and you will see a control point added and a curve.
Right click on a control point to delete it. Use the Toggle curve button  to temporarily disable the curve.
The Curves control is used in combination with the other Levels controls, such as the central gamma control, and the black and white input and output levels. This means you can have both a manually entered curve, and still make general adjustments such as adjusting the gamma, or even the contrast on the main Photo Tool InfoBar.
This example shows a manually entered curve with three control points. In this example the mid to dark shades have all be lifted (lightened), but the brighter shades of the photo (right side of the curve) have not been altered at all.
The histogram graph shows both the original histogram (dark red) of the unmodified photo and the modified histogram (pale red overlaid) that is the result of the adjusted curve.
Levels Tool notes
- The Levels dialog works in conjunction with the Brightness and Contrast sliders. You can use both sets of controls together or separately. All will alter the overall brightness levels, and all changes are reflected in the histogram and green mapping line.
- The Levels dialog is non-modal, which means that while it's on screen you can continue to use Xara Designer Pro+ as usual. It will update to show the histogram levels of any photo selected, and will show blank if none, or multiple, photos are selected.
Copyright © Xara